数据透视网格
许多类在使用配置对象创建(实例化)类时都有快捷名称。快捷名称称为 别名(如果类扩展了 Ext.Component,则称为 xtype)。别名/xtype 列在适用类的类名旁边,以便快速参考。
框架类或其成员可以指定为 private 或 protected。否则,类/成员为 public。Public、protected 和 private 是访问描述符,用于传达类或类成员应如何以及何时使用。
Public 类和类成员可供任何其他类或应用程序代码使用,并且在主要产品版本中可以作为稳定和持久的依赖项。Public 类和成员可以通过子类安全地扩展。
Protected 类成员是稳定的 public 成员,旨在由拥有类或其子类使用。Protected 成员可以通过子类安全地扩展。
Private 类和类成员在框架内部使用,不供应用程序开发人员使用。Private 类和成员可能会随时更改或从框架中省略,恕不另行通知,并且不应在应用程序逻辑中依赖。
static 标签。 *请参阅下面的静态。下面是一个类成员示例,我们可以对其进行剖析以显示类成员的语法(在本例中是从 Ext.button.Button 类查看的 lookupComponent 方法)。
让我们看一下成员行的每个部分
lookupComponent)( item ))Ext.Component)。对于除了 undefined 之外不返回任何内容的方法,可以省略此项,或者可以显示为以正斜杠 / 分隔的多个可能值,表示返回的内容可能取决于方法调用的结果(即,如果 get 方法调用成功,方法可能返回 Component,如果失败,则返回 false,这将显示为 Ext.Component/Boolean)。PROTECTED - 请参阅下面的标志部分)Ext.container.Container)。如果成员源自当前类,则源类将显示为蓝色链接,如果是从祖先类或混合类继承,则显示为灰色。查看源代码)item : Object)。undefined 之外的值,则“返回值”部分将注明返回的类或对象类型以及描述(示例中为 Ext.Component)Available since 3.4.0 - 示例中未显示),紧接在成员描述之后Defaults to: false)API 文档使用许多标志来进一步传达类成员的功能和意图。标签可以用文本标签、缩写或图标表示。
classInstance.method1().method2().etc();false,则标记为 preventable 的事件将不会触发- 表示框架类
- Singleton 框架类。 *有关更多信息,请参阅 singleton 标志
- 组件类型框架类(Ext JS 框架中扩展 Ext.Component 的任何类)
- 表示类、成员或指南在当前查看的版本中是新的
- 表示 config 类型的类成员
- 表示 property 类型的类成员
- 表示 method 类型的类成员
- 表示 event 类型的类成员
- 表示 theme variable 类型的类成员
- 表示 theme mixin 类型的类成员
- 表示类、成员或指南在当前查看的版本中是新的
在 API 文档页面上,类名正下方是一行按钮,对应于当前类拥有的成员类型。每个按钮显示按类型划分的成员计数(此计数会随着过滤器的应用而更新)。单击按钮会将您导航到该成员部分。将鼠标悬停在成员类型按钮上将显示该类型的所有成员的弹出菜单,以便快速导航。
与类 config 选项相关的 Getter 和 setter 方法将显示在方法部分以及 API 文档和成员类型菜单的 config 部分中,紧挨着它们所作用的 config 下方。Getter 和 setter 方法文档将在 config 行中找到,以便于参考。
您的页面历史记录保存在本地存储中,并显示在顶部标题栏下方(使用可用的实际空间)。默认情况下,显示的唯一搜索结果是与您当前查看的产品/版本匹配的页面。您可以通过单击历史记录栏右侧的 按钮并选择“全部”单选按钮来展开显示的内容。这将显示所有产品/版本在历史记录栏中的所有最近页面。
在历史记录配置菜单中,您还将看到最近访问页面的列表。结果按“当前产品/版本”和“全部”单选按钮进行过滤。单击 按钮将清除历史记录栏以及本地存储中保存的历史记录。
如果在历史记录配置菜单中选择“全部”,则将启用“在历史记录栏中显示产品详细信息”复选框选项。选中后,每个历史页面的产品/版本将在历史记录栏中与页面名称一起显示。将光标悬停在历史记录栏中的页面名称上也会将产品/版本显示为工具提示。
可以使用页面顶部的搜索字段搜索 API 文档和指南。
在 API 文档页面上,还有一个过滤器输入字段,该字段使用过滤器字符串过滤成员行。除了按字符串过滤外,您还可以按访问级别、继承和只读过滤类成员。这是通过使用页面顶部的复选框完成的。
API 类导航树底部的复选框过滤类列表,以包含或排除私有类。
单击空的搜索字段将显示您最近 10 次搜索,以便快速导航。
每个 API 文档页面(JavaScript 原始类型页面除外)都有一个与该类相关的元数据菜单视图。此元数据视图将具有以下一项或多项
Ext.button.Button 类具有 Ext.Button 的备用类名称)。备用类名称通常为了向后兼容性而维护。可运行的示例 (Fiddles) 默认在页面上展开。您可以使用代码块左上角的箭头单独折叠和展开示例代码块。您还可以使用页面右上角的切换按钮切换所有示例的折叠状态。切换所有状态将在页面加载之间记住。
类成员默认在页面上折叠。您可以使用成员行左侧的箭头图标或全局使用右上角的展开/折叠所有切换按钮来展开和折叠成员。
在较窄的屏幕或浏览器上查看文档将导致针对较小外形尺寸优化的视图。桌面视图和“移动”视图之间的主要区别在于
可以通过单击 API 文档页面顶部的类名来查看类源代码。可以通过单击成员行右侧的“查看源代码”链接来查看类成员的源代码。
数据透视网格组件可以快速汇总大量数据集。它提供了一种简单的方法,可以将许多数据点浓缩成一种格式,使趋势和见解更加明显。一个经典的例子是销售数据。公司通常会记录给定时期内的所有销售额。这通常包含数千行数据。数据透视网格允许您查看每个销售人员的业绩、哪些城市产生最多的收入、产品在城市之间的表现等等。
注意: 本指南涵盖了 Ext JS SDK 高级版中捆绑的数据透视包。
假设您有以下网格面板
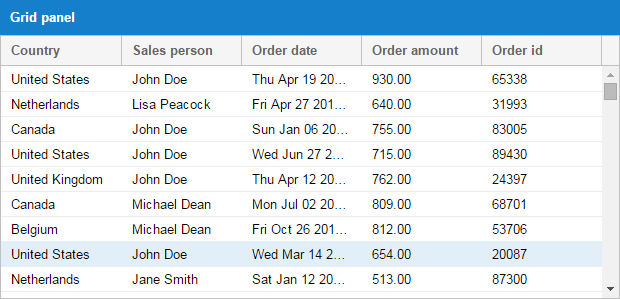
您如何轻松地实现客户端解决方案来回答以下问题?
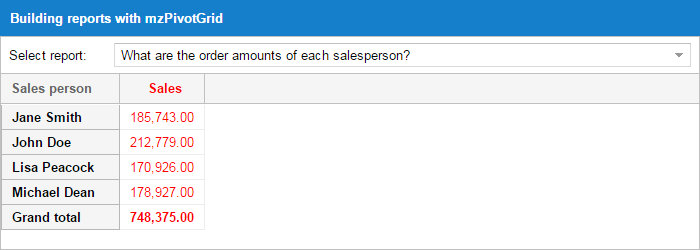
John Doe 的总订单金额是多少?
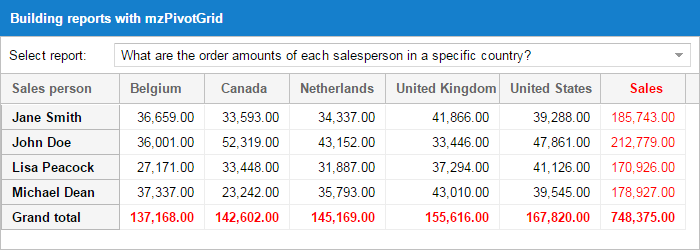
按国家/地区划分的总订单金额是多少?
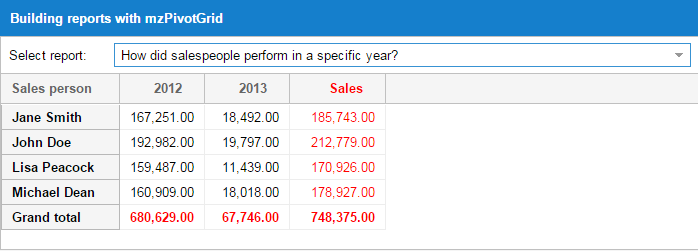
销售人员在特定年份的表现如何?
这些是数据透视网格解决的各种挑战。让我们看看如何可视化答案。
数据透视网格未捆绑在 Ext JS 框架中,但很容易要求将其纳入您的应用程序中。无论您是在使用 Sencha Cmd 生成的应用程序还是您自己设计的应用程序结构,包含数据透视网格代码和样式都只需要几个步骤。
Sencha 数据透视网格适用于 Sencha Ext JS 的经典和现代工具包。
使用数据透视网格不需要 Sencha Cmd。但是,使用 Cmd 允许您通过应用程序的 app.json 文件无缝包含数据透视网格包。
数据透视网格随附完整源代码,这些源代码以使其易于部署到应用程序的 packages 文件夹的方式打包。
要在应用程序中包含数据透视网格,只需修改应用程序根目录中的 app.json 文件以要求数据透视网格包
{

    "name": "YourApp",

    "requires": [

        "pivot"

    ],

    "id": "391a5ff6-2fd8-4e10-84d3-9114e1980e2d"

}
该包支持经典和现代工具包,因此无需工具包相关的配置。
SDK 包含数据透视网格代码的编译版本,该版本适用于不使用 Sencha Cmd 的用户。要以这种方式包含数据透视网格,请从您的索引页面链接以下资产
{unzippedFolder}/packages/pivot/build/{toolkit}/pivot.js

{unzippedFolder}/packages/pivot/build/{toolkit}/{themeName}/resources/pivot-all.css
将以下内容包含在您的应用程序目录中
{unzippedFolder}/packages/pivot/build/{toolkit}/{themeName}/resources/images/
数据透视网格依赖于扩展本机网格面板的两个部分 - 轴和聚合。轴允许您确定行和列的位置,而聚合管理分组计算。这些部分需要在数据透视网格使用的透视矩阵对象上定义。
让我们通过想象上面讨论的用例来深入研究数据透视网格。首先,我们将数据集分解为销售人员和年份。我们可以通过配置顶部和左侧轴来做到这一点
{
    xtype: 'pivotgrid',

    matrix: {

        leftAxis: [{

            width: 80,

            dataIndex: 'salesperson',

            header: 'Salesperson'

        }],

        topAxis: [{

            dataIndex: 'year',

            header: 'Year',

            direction: 'ASC'

        }]

        // ... more configs
    }
}
这将产生如下所示的视图
接下来,我们将设置聚合,以便可以适当地计算单元格值。
数据透视网格开箱即用地包含许多聚合方法。
sum
average
min
max
count
groupSumPercentage - 如果 John 在美国和德国销售商品,您可能想查看在美国的销售额占总销售额的百分比。groupSumPercentage 方法计算当前项目总和占父项目总和的百分比。
groupCountPercentage - 这与 groupSumPercentage 相同,但使用计数而不是总和。
variance
varianceP
stdDev
stdDevP
您也可以为您自己的自定义处理提供聚合函数。以下示例演示了如何通过在聚合数组中配置每个聚合器来聚合多个字段(销售额和数量)。如您所见,我们正在为数量使用自定义聚合器。
{
    xtype: 'pivotgrid',

    matrix: {

        aggregate: [{

            measure: 'amount',

            header: 'Sales',

            aggregator: 'sum',

            align: 'right',

            width: 85,

            renderer: Ext.util.Format.numberRenderer('0,000.00')

        }, {

            measure: 'orderid',

            header: 'Qnt',

            aggregator: function(records, measure, matrix, rowGroupKey, colGroupKey) {

                // custom aggregator logic

                return records.length;

            },

            align: 'right',

            width: 85,

            renderer: Ext.util.Format.numberRenderer('0,000.00')

        }]

        // ... more configs
    }
}
以上只是一个简单的示例,展示了可能性。如果您要编写自己的聚合方法,最好覆盖 Ext.pivot.Aggregators。在覆盖中,您可以添加您的函数,并将函数名称用作聚合器配置名称。
Ext.define('Overrides.pivot.Aggregators', {

    override: 'Ext.pivot.Aggregators',

    myOwnFnText: 'My special fn', // useful when using the Configurator plugin
    myOwnFn: function(records) {

        // custom aggregator logic

        return records.length;

    }

});

// Then you can define your aggregate config in this manner

aggregate: [{

    // ...

    dataIndex:    'field',

    aggregator: 'myOwnFn'

    // ...

}]
也可以在 ViewController 中定义聚合函数。
Ext.define('App.view.Pivot', {
    extend: 'Ext.pivot.Grid',
    controller: 'pivot',

    matrix: {
        aggregate: [{

            // ...

            dataIndex: 'field',

            aggregator: 'myOwnFn'

            // ...

        }]

        // ...
    }
});

Ext.define('App.view.PivotController', {
    extend: 'Ext.app.ViewController',

    alias: 'controller.pivot',

    myOwnFn: function(records, measure, matrix, rowGroupKey, colGroupKey){
        // custom aggregate function
        return records.length;
    }
});
在定义维度时,您可以设置以下配置以影响排序结果。
sortable: True 表示对结果进行排序(默认值为 true)。
direction: 您可以指定是否要对结果进行排序(升序)ASC 或(降序)DESC(默认值为 ASC)。
caseSensitiveSort: 配置为 true 以使过滤与精确的大小写匹配(默认值为 true)。
sorterFn: 自定义排序器函数。
sortIndex: 您可能希望使用记录上另一个字段的值对结果进行排序。假设您有一个字段“month-name”,其值为 Jan、Feb 等,另一个字段“month-value”,其值为 1、2 等。对“month-name”(dataIndex)的结果进行排序并按“month-value”(sortIndex)排序是有意义的。
默认情况下,数据透视网格计算行总计。您可以选择是否显示总计。可以通过两种方式在行上添加多个总计
您可以监听数据透视网格触发的 pivotbuildtotals 事件。事件处理程序作为参数传递,其中包含总计值数组和默认值。该数组中的每个对象都应具有一个“title”和一个“values”数组,该数组将用于生成总计记录。
您可以扩展其中一个矩阵类,并使用模板方法 onBuildTotals 来执行与上述相同的逻辑。
您提供的新总计将以数据透视网格中的默认总计样式设置样式。
// ...

listeners: {

    pivotbuildtotals: function(matrix, totals) {

        var dataAvg = {},

            dataMax = {};

        Ext.Array.each(matrix.model, function(field) {

            var result,

            agg;

            if (field.col && field.agg) {

                agg = matrix.aggregate.getByKey(field.agg);

                result = matrix.results.get(matrix.grandTotalKey, field.col);

                if (result && agg) {

                    dataAvg[field.name] = result.calculateByFn(
                                            'totalavg',
                                            agg.dataIndex,
                                            Ext.pivot.Aggregators.avg);

                    dataMax[field.name] = result.calculateByFn(
                                            'totalmax',
                                            agg.dataIndex,
                                            Ext.pivot.Aggregators.max);

                }

            }

        });

        totals.push({

            title: 'Grand total (avg)',

            values: dataAvg

        }, {

            title: 'Grand total (max)',

            values: dataMax

        });

    }

}

// ...
假设您在一个轴上有年份的结果,并且您想将它们分组为 80 年代、90 年代等等。您可以通过两种方式实现此目的
您可以在维度上定义一个“grouperFn”,该维度将传递记录并应返回组值(即 80 年代、90 年代等)。
您可以在源模型上定义一个新字段,该字段具有“convert”函数并且执行与上述相同的操作。
grouperFn 示例
leftAxis: [{

    // ...

    grouperFn: function(record) {

        var dataIndex = this.dataIndex,

            recIndex = record.get(dataIndex);

        if (recIndex >= 1980 && recIndex < 1990) return "80'";

        if (recIndex >= 1990 && recIndex < 2000) return "90'";

        return 'Rest';

    }

    // ...

}]
数据透视网格提供两种类型的过滤器
标签过滤器允许您通过评估为顶部或左侧轴结果生成的值(即,以...开头、不以...开头、以...结尾等)来过滤结果。
值过滤器允许您通过评估为每个顶部/左侧轴对计算的值(即,等于、大于、前 10 个项目、前 10% 百分比、前 10 个总和等)来过滤结果。
过滤器在左侧或顶部轴的维度项目上配置。
aggregate: [{
    id: 'agg1',

    dataIndex: 'value',

    aggregator: 'sum',

    header: 'Total'
}],

leftAxis: [{

    // ...

    filter: {

        type: 'value',

        operator: 'top10',

        topOrder: 'top',

        topType: 'sum',

        value: 9500,

        dimensionId: 'agg1'

    }

    // ...

}]
有关更多信息,请查看过滤器类 (Ext.pivot.filter.*)。
一旦数据透视网格的计算完成,数据透视存储中可能会有数千条记录。为了防止 DOM 过载,您可能需要使用 BufferedRenderer 插件。BufferedRenderer 自 Ext JS 4.2.0 版本以来一直可用。在版本 5+ 中,默认情况下在网格面板上使用 BufferedRendering。
BufferedRenderer 允许用户滚动浏览数千条记录,而不会产生一次性渲染屏幕上所有记录的性能损失。
数据透视网格通过 viewLayoutType 配置提供两种布局类型:轮廓和紧凑。
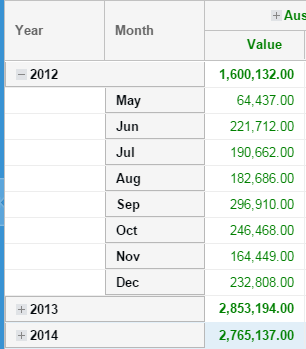
{
    xtype: 'pivotgrid',

    matrix: {

        viewLayoutType: 'outline'

        // ... more configs
    }
}
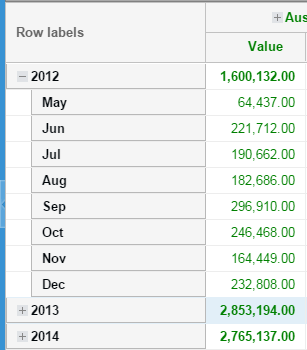
{
    xtype: 'pivotgrid',

    matrix: {

        viewLayoutType: 'compact',

        compactViewColumnWidth: 250,

        textRowLabels: 'Row labels'

        // ... more configs
    }
}
总计的位置可以为左轴和顶轴配置。总计可以设置为 first、last 或 none。
当组折叠时,组总计将始终可见。无论为总计配置什么,当在一个轴上配置多个维度时,都会发生这种情况。当组展开时,也将使用相同的配置。
{
    xtype: 'pivotgrid',

    matrix: {

        rowSubTotalsPosition:       'first',

        rowGrandTotalsPosition:     'last',

        colSubTotalsPosition:       'last',

        colGrandTotalsPosition:     'last'

        // ... more configs
    }
}
渲染器可用于格式化轴结果的标签。例如
{
    xtype: 'pivotgrid',

    matrix: {

        topAxis: {
            dataIndex: 'month',

            labelRenderer: function(value){
                return Ext.Date.monthNames[value];
            }
        }

        // ... more configs
    }
}
也可以用于格式化聚合维度上的输出值
{
    xtype: 'pivotgrid',

    matrix: {

        aggregate: [{
            dataIndex: 'amount',

            aggregator: 'sum',

            formatter: 'number("0,000.00")'
        }, {
            dataIndex: 'qty',

            aggregator: 'sum',

            renderer: Ext.util.Format.numberRenderer('0,000.00')
        }]

        // ... more configs
    }
}
ViewController 也可以用于定义渲染器。
Ext.define('App.view.Pivot', {
    extend: 'Ext.pivot.Grid',
    controller: 'pivot',

    matrix: {
        topAxis: {
            // ...

            dataIndex: 'month',

            labelRenderer: 'monthRenderer'

            // ...
        },

        aggregate: [{
            // ...

            dataIndex: 'field',

            renderer: 'myOwnFn'

            // ...
        }]

        // ...
    }
});

Ext.define('App.view.PivotController', {
    extend: 'Ext.app.ViewController',

    alias: 'controller.pivot',

    monthRenderer: function(value){
        return Ext.Date.monthNames[value];
    },

    myOwnFn: function(value, meta, record){
        // custom renderer function
        return value;
    }
});
透视表格的样式取决于所使用的工具包。
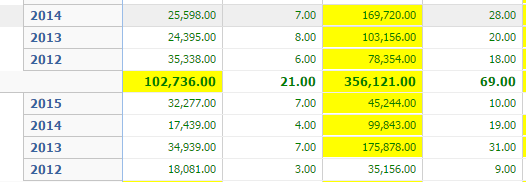
聚合维度渲染器可用于设置单元格样式和格式化输出值
{
    xtype: 'pivotgrid',

    matrix: {

        aggregate: {
            dataIndex: 'amount',

            aggregator: 'sum',

            renderer: function(value, meta, record) {

                if (value > 40000) {

                    meta.style = "background-color: yellow;";

                }

                return Ext.util.Format.number(value, '0,000.00');

            }
        }

        // ... more configs
    }
}
使用上述渲染器,生成的网格输出将显示为
渲染器配置也可以在左轴维度上使用,以设置单元格样式。
您还可以在渲染器函数中定义更复杂的逻辑。例如,当总和低于模型上某些其他字段的平均值时,以下渲染器会以不同的方式设置单元格样式。
{
    xtype: 'pivotgrid',

    matrix: {

        aggregate: {
            dataIndex: 'amount',

            aggregator: 'sum',

            renderer: function(value, meta, record, recordIndex, columnIndex, store, view) {

                var grid = view.up('pivotgrid'),

                    topItem = grid.getTopAxisItem(meta.column),

                    leftItem = grid.getLeftAxisItem(record),

                    result;

                if (topItem && leftItem) {

                    result = grid.getMatrix().results.get(leftItem.key, topItem.key);

                    // if you already have the avg configured on another
                    // dimension just fetch the result

                    // result.getValue('avg')

                    // otherwise calculate the result

                    result.calculateByFn('avg', 'some-other-field', Ext.pivot.Aggregators.avg);

                    if (value < result.getValue('avg')) {

                        meta.style = "background-color: yellow;";

                    }

                }

                return Ext.util.Format.number(value, '0,000.00');

            }

        }

        // ... more configs
    }
}
让我们看看这个例子
 {
     xtype: 'pivotgrid',
     itemConfig: {
         viewModel: {
             type: 'pivot-row-model'
         },
         bind: {
             userCls: '{rowStyle}'
             // or you can define a template
             //userCls: '{record.isRowGroupHeader:pick("","pivotRowHeader")}'
         }
     }
     // ... more configs
 }
在 ViewModel 中,我们将声明一个公式,该公式将使用记录数据。记录具有为该行显示的所有值以及以下附加字段
所有这些属性都可以帮助我们设置整行的样式,而无需了解有关生成的列的任何信息。
在某些情况下,我们可能希望设置透视表格中生成的正值和负值的样式。这可以如下完成。
 {
     xtype: 'pivotgrid',
     itemConfig: {
         viewModel: {
             type: 'default'
         }
     },
     topAxisCellConfig: {
         bind: {
             userCls: '{value:sign("pivotCellNegative","pivotCellPositive")}'
         }
     }
     // ... more configs
 }
以下数据可用于绑定模板中
注意: 在这种情况下,您不能使用公式,因为列和值是动态生成的,无法在公式中替换。
也可以设置来自左轴或聚合的特定维度的样式
 {
     xtype: 'pivotgrid',
     itemConfig: {
         viewModel: {
             type: 'default'
         }
     },
     matrix: {
         aggregate: [{
             dataIndex:  'value',
             aggregator: 'sum',
             align:      'right',
             cellConfig: {
                 bind: {
                     userCls: '{value:sign("pivotCellNegative","pivotCellPositive")}'
                 }
             }
         },{
             dataIndex:  'value',
             aggregator: 'count'
         }],
         leftAxis: [{
             dataIndex:  'person',
             // This is used only when `viewLayoutType` is `outline`
             cellConfig: {
                 bind: {
                     userCls: '{record.isRowGroupHeader::pick("","pivotRowHeader")}'
                 }
             }
         },{
             dataIndex:  'country'
         }]
         // ... more configs
     }
 }
这种情况允许您定义在单元格绑定中使用的公式。请注意,这意味着每个单元格都将有自己的 ViewModel,这可能会降低透视表格的性能。仅在必要时使用它。
 {
     xtype: 'pivotgrid',
     leftAxisCellConfig: {
         viewModel: {
             type: 'default'
         },
         bind: {
             userCls: '{record.isRowGroupHeader::pick("","pivotRowHeader")}'
         }
     },
     topAxisCellConfig: {
         viewModel: {
             type: 'pivot-cell-model' // to be able to define your own formulas
         },
         bind: {
             userCls: '{value:sign("pivotCellNegative","pivotCellPositive")}'
             //userCls: '{column.isColGrandTotal:pick(null,"pivotCellGrandTotal")}'
             //userCls: '{cellCls}
         }
     }
     // ... more configs
 }
这种方法使您可以在绑定模板和公式中使用 record、column 和 value。
如果多个聚合维度可用,并且您想要设置其中一个维度的样式,则可以像这样在该维度上定义绑定
 {
     xtype: 'pivotgrid',
     matrix: {
         aggregate: [{
             dataIndex:  'value',
             aggregator: 'sum',
             align:      'right',
             cellConfig: {
                 viewModel: {
                     type: 'pivot-cell-model'
                 },
                 bind: {
                     userCls: '{value:sign("pivotCellNegative","pivotCellPositive")}'
                     //userCls: '{column.isColGrandTotal:pick(null,"pivotCellGrandTotal")}'
                     //userCls: '{cellCls}
                 }
             }
         },{
             dataIndex:  'value',
             aggregator: 'count'
         }]
         // ... more configs
     }
 }
透视表格可以通过使用 stateful: true 以及 stateId 配置为有状态的。该状态将保存您为左轴、顶轴和聚合提供的所有维度配置。它还将回忆起展开或折叠组的状态。
注意: 此功能仅在经典工具包中可用。
您可以通过在透视表格上设置 enableLocking: true 来“锁定”左轴列。
这允许您仅滚动顶轴生成的列。
注意: 此功能仅在经典工具包中可用。
此插件允许用户编辑透视表格单元格。它使用 updaters 来处理透视表格单元格后面的记录。
{
    xtype: 'pivotgrid',

    plugins: [{
        ptype: 'pivotcellediting',
        clicksToEdit: 1,
        defaultUpdater: 'uniform' // define here the type of editing: 'overwrite', 'increment', 'percentage', 'uniform'
    }]

    // ... more configs
}
可以定义更多 updaters。有关更多信息,请查看 updater 类 (Ext.pivot.update.*)。
该插件还提供了在透视表格上触发的两个事件,您可以使用它们来预处理/后处理编辑:pivotbeforeupdate 和 pivotupdate。
注意: 此功能仅在经典工具包中可用。
此插件允许用户编辑透视表格结果。用户可以双击透视表格单元格,这将打开一个窗口,其中包含用于更新的各种字段。以下类型的编辑可用
percentage:提供的值是一个百分比,应用于增加该单元格后面所有记录的值。
increment:提供的值将添加到每个记录上的现有值。
overwrite:提供的值将替换每个记录上的现有值。
uniform:提供的值将均匀分布在所有记录上。
该插件还提供了在透视表格上触发的两个事件,您可以使用它们来预处理/后处理编辑:pivotbeforeupdate 和 pivotupdate。
向下钻取插件允许用户向下钻取到透视表格结果中。用户可以双击透视表格单元格,这将打开一个对话框窗口,其中包含一个网格,该网格包含由单元格源化的记录。
可以通过在插件上配置 columns 配置(与普通 Ext JS 网格的方式相同)来自定义在该向下钻取窗口中呈现的网格。
当在透视表格中使用远程计算时,需要提供 remoteStore 配置,该配置将由插件过滤。
导出器插件允许将透视表格结果导出到类系统中可用的任何导出器类型。该插件使用 exporter 包,该包开箱即用地附带以下导出器
excel Excel 2007 xlsx 格式
xml Excel 2003 xml 格式
csv CSV 文件
tsv TSV 文件
html Html 文件
该插件向透视表格组件添加了两个新方法
saveDocumentAs:此函数将保存导出的文件
getDocumentData:返回导出的文档内容
这两个函数都接受一个配置对象作为参数
type:这是导出器类型(默认为 excel)。
onlyExpandedNodes:设置为 true 以仅导出展开的组(默认为 false)。
showSummary:设置为 false 以从导出中排除总计(默认为 true)。
title:设置要在导出文档中的列标题上方显示的标题。
fileName:保存文件的名称。
每个导出器都可能带有自己的一组附加配置。当调用这些函数之一时,可以将这些配置提供给上面的配置对象。
saveDocumentAs 尝试使用浏览器特定功能保存文档。如果浏览器没有保存文件的功能,则生成的文件的内容将发送到服务器脚本,并且服务器使用可下载文件的正确标头响应。
服务器脚本的 URL 可以在 Ext.exporter.File#property-url 中自定义,服务器脚本可以托管在内部。Node 和 PHP 的实现可以在 exporter 包的 server 文件夹中找到。
配置器插件允许用户使用拖放功能轻松配置透视表格。
此插件最重要的配置是 fields。这必须是可以用于通过 DND 配置透视表格的字段数组。当使用本地矩阵且 fields 配置为空时,插件将自动从 store 模型中提取所有字段。
每个 field 都有一个 settings 配置,该配置为字段使用提供了一些限制。以下配置可以在 settings 中定义
cls:要添加到此配置器字段的 CSS 类
style:类似于 Ext.Component#cfg-style。
fixed:如果您希望字段固定在特定区域,则必须在此处定义这些区域。可能的值:aggregate、leftAxis、topAxis。
allowed:在此处定义可以使用此字段的区域。可能的值:aggregate、leftAxis、topAxis。
aggregators:在此处定义当字段配置为聚合时可以使用的函数。
renderers:这些渲染器仅在聚合维度上使用。
formatters:格式化器仅在聚合维度上使用。
例子
Ext.define('App.view.Pivot', {
    extend: 'Ext.pivot.Grid',
    controller: 'pivot',

    plugins: {
        ptype: 'pivotconfigurator', // use `type` for modern toolkit

        fields: [{
            dataIndex:  'quantity',
            header:     'Qty',
            // You can even provide a default aggregator function to be used when this field is dropped
            // on the agg dimensions
            aggregator: 'min',
            formatter: 'number("0")',

            settings: {
                // Define here in which areas this field could be used
                allowed: ['aggregate'],
                // Set a custom style for this field to inform the user that it can be dragged only to "Values"
                style: {
                    fontWeight: 'bold'
                },
                // Define here custom formatters that ca be used on this dimension
                formatters: {
                    '0': 'number("0")',
                    '0%': 'number("0%")'
                }
            }
        }, {
            dataIndex:  'amount',
            header:     'Value',

            settings: {
                // Define here in which areas this field could be used
                allowed: 'aggregate',
                // Define here what aggregator functions can be used when this field is
                // used as an aggregate dimension
                aggregators: ['sum', 'avg', 'count'],
                // Set a custom style for this field to inform the user that it can be dragged only to "Values"
                style: {
                    fontWeight: 'bold'
                },
                // Define here custom renderers that can be used on this dimension
                renderers: {
                    'Colored 0,000.00': 'coloredRenderer' // coloredRenderer is a function on the ViewController
                },
                // Define here custom formatters that ca be used on this dimension
                formatters: {
                    '0': 'number("0")',
                    '0.00': 'number("0.00")',
                    '0,000.00': 'number("0,000.00")',
                    '0%': 'number("0%")',
                    '0.00%': 'number("0.00%")'
                }
            }
        }, {
            dataIndex:  'year',
            header:     'Year',

            settings: {
                // Define here the areas in which this field is fixed and cannot be moved from
                fixed: ['topAxis']
            }
        }, {
            dataIndex:      'month',
            header:         'Month',
            labelRenderer:  'monthLabelRenderer', // monthLabelRenderer is a function available on the ViewController

            settings: {
                // Define here what aggregator functions can be used when this field is
                // used as an aggregate dimension
                aggregators: ['count'],
                // Define here in which areas this field could be used
                allowed: ['leftAxis', 'topAxis']
            }
        }]
    }
});

Ext.define('App.view.PivotController', {
    extend: 'Ext.app.ViewController',

    alias: 'controller.pivot',

    monthLabelRenderer: function(value){
        return Ext.Date.monthNames[value];
    },

    // implementation for classic toolkit
    //coloredRenderer: function(v, meta){
    //    if(meta) {
    //        meta.style = Ext.String.format('color: {0};', v > 500 ? 'green' : 'red');
    //    }
    //    return Ext.util.Format.number(v, '0,000.00');
    //}

    // implementation for modern toolkit
    coloredRenderer: function(v, record, dataIndex, cell, column){
        cell.setStyle( Ext.String.format('color: {0};', v > 500 ? 'green' : 'red') );
        return Ext.util.Format.number(v, '0,000.00');
    }
});
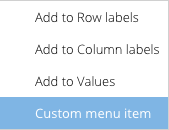
配置器插件在透视表格上触发事件,这些事件允许您进一步自定义用户交互。在经典工具包实现中,其中一个这样的事件是 beforeshowconfigfieldmenu,它允许您在配置器字段菜单中定义更多菜单。
Ext.define('App.view.Pivot', {
    extend: 'Ext.pivot.Grid',
    controller: 'pivot',

    plugins: 'pivotconfigurator',

    matrix: {
        // ...
    },

    listeners: {
        beforeshowconfigfieldmenu: 'getCustomMenus'
    }
});

Ext.define('App.view.PivotController', {
    extend: 'Ext.app.ViewController',

    alias: 'controller.pivot',

    getCustomMenus: function (panel, options) {
        options.menu.add({
            text: 'Custom menu item',
            handler: function(){
                Ext.Msg.alert('Custom menu item', Ext.String.format('Do something for "{0}"', options.field.getHeader()));
            }
        });
    }

});
矩阵类触发的大多数事件都与 pivot 前缀一起中继到透视表格。
基础矩阵类构建顶轴和左轴项目。它还计算每个左/顶项目对的结果。
将您的矩阵类型设置为 local 表示浏览器将负责计算数据。本地矩阵非常适合中小型数据集。
{
    xtype: 'pivotgrid',

    // ...

    matrix: {

        type: 'local', // default value

        store: 'YourStore',

        recordsPerJob: 1000,

        timeBetweenJobs: 2,

        leftAxis: [],

        topAxis: [],

        aggregate: []

    }

    // ...

}
本地矩阵在多个作业中处理 store 记录,以帮助防止在使用中型数据集时浏览器过载。您可以选择配置每个作业应处理多少条记录以及作业之间等待多长时间。
在浏览器中计算大型数据集可能需要很长时间,并可能导致浏览器变得无响应。如果您正在处理大型数据集,则应使用远程矩阵。远程矩阵将序列化您的所有配置并将其发送到服务器,以便您可以远程执行计算。
{
    xtype: 'pivotgrid',

    // ...

    matrix: {

        type: 'remote',

        url: 'http://your-backend-url',

        timeout: 3000, // optional config used by the Ajax call

        leftAxis: [],

        topAxis: [],

        aggregate: []

    }

    // ...

}
leftAxis、topAxis 和 aggregate 是维度项目对象的数组。这些数组被序列化并在 Ajax 请求中作为参数发送。
params = {

    leftAxis: leftAxis,

    topAxis: topAxis,

    aggregate: aggregate,

    grandTotalKey: 'grandtotal', // the value configured for grandTotalKey on the matrix

    keysSeparator: '#_#' // the value configured for keysSeparator on the matrix

};

// ...

Ext.Ajax.request({

    // ...

    url: me.url,

    timeout: me.timeout,

    jsonData: params,

    // ...

});
在执行 Ajax 调用之前,通过 beforerequest 事件(实际上作为 pivotbeforerequest 中继到透视表格)或通过模板方法 onBeforeRequest 收集其他参数。
透视表格期望特定格式的 JSON 响应。响应应返回 leftAxis 和 topAxis 的项目数组以及所有左/顶项目对的结果。
注意: “id”属性非常重要。如果未指定,将生成一个 id。
{

    success: true,

    leftAxis: [{

        key: '-1276511163', // provide your own key but be careful to avoid conflicts with keysSeparator

        value: 'Macromedia',

        // following is the id of the dimension, the one that you
        // provided or was generated

        dimensionId: 'leftAxis1'

    }, {

        // when multiple dimensions are provided then the result key
        // should be formatted like this

        key: '-1276511163#_#243243', // use the keysSeparator that was sent to the server

        value: 'Steve',

        // following is the id of the dimension, the one that you
        // provided or was generated

        dimensionId: 'leftAxis2'

    }],

    topAxis: [{

        // same like leftAxis

    }],

    results: [{

        leftKey: '-1276511163',

        topKey: '34535345435',

        values: {

            agg1: 4345.34, // agg1 is the id of the aggregate dimension

            agg2: 244 // agg2 is the id of the 2nd aggregate dimension defined

        }

    }]

}
名为“grandtotal”的键是为矩阵生成的,用于总计计算。您可以通过更改 matrix.grandTotalKey 的值来修改此命名方案。
如果在 leftKey 和 topKey 上都使用,则它表示两个轴的总计。
如果用于 leftKey,则它表示为每个提供的 topKey 的列的总计。
如果用于 topKey,则它表示为每个提供的 leftKey 的行的总计。
pivot 包中的 server 文件夹包含一个 PHP 示例,该示例展示了服务器端计算的一种方法。也就是说,您也可以使用任何服务器端语言编写自己的实现,只要它返回上面描述的 JSON 对象即可。
如果服务器计算失败,您可以发回 success: false 以及您可能希望在透视客户端中处理的任何其他元数据信息。远程矩阵类将识别到调用失败,并将触发“requestexception”事件,该事件作为“pivotrequestexception”中继到透视表格。
Sencha 透视表格为从大型数据集中收集摘要提供了理想的解决方案。数据集中的特定字段可以突出显示为完整数据集的定量汇总,这允许用户从多个角度可视化数据集。
有关如何配置透视表格的更多示例,请参阅 SDK 下载中的 KitchenSink 示例文件夹。


 Ext JS | 使用条款
